


shopping around for the data that fits
The debate over Social Security reform is going to be an unusually technical one by current standards. I guess I’m about to make it even more so. My bad.
In these sorts of political fights both the “hawks” (i.e., the pro-SS reform folks) and “doves” (i.e., the anti-SS reform folks) will seek out data and opinions that favor their argument.
One time-honored tactic is to select the data that makes your argument look the best. I will be using FactCheck.org’s analysis of Bush’s as a concrete example of shopping around for data fits your spin.
First a little about FactCheck.org. They claim to be:
For my part, I’ve generally considered them to be reasonably fair during the 2004 elections. I have a rather different view of their neutrality regarding Social Security reform, however. I’ve discerned that FactCheck.org—or at least some of the folks who work their—are apparently are opponents of Bush’s Social Security reform.
I have a number of other issues with their analysis of Bush’s proposals but I intend to deconstruct these in a future post.
Social Security “doves” oppose personal accounts. Attacking personal account requires the doves to find data that makes personal accounts appear as unprofitable as possible. Since personal accounts will be at least partially based on stock market returns the doves need defendable data showing the historical stock market returns from the worst available viewpoint. FactCheck.org did this in two ways:
I’ll deal with my second point first. Presenting the stock market returns as corrected for inflation is OK since increases due to inflation are illusionary. Correcting for inflation is presents the investor’s true gains.
It also yields the lowest possible stock market return numbers; which is why I suspect how FactCheck.org selected them.
I normally wouldn’t have thought using inflation corrected stock market returns would have been noteworthy if the rest of FactCheck.org’s analysis was balanced.
OK, now I want to discuss my first point: FactCheck.org presented average stock market returns from 1802 through 1991. On the face of it, it seems prudent to use all of the historical data available, after all, the more data the better right? Well, it isn’t better if you leave out pertinent data.
FactCheck.org used stock market return data provided by Wharton finance professor Jeremy Siegel. Jeremy Siegel determined that average, real (i.e., inflation and depression corrected) stock market returns from 1802 through 1991 was 6.8 percent a year.
So? What’s my problem with this? My issue is that there have been structural changes to our economic system that occurred in 1935 when Federal Reserve act restored to the Federal Reserve all of the powers necessary to make it a fully functional central bank. Furthermore, data provided by FactCheck.org’s own authority on stock market returns, Jeremy Siegel, proves my point.
Jeremy Siegel made the following statement regarding long term prospects for returns on stocks:
First, note well that this data is not corrected for inflation. That means, for example, that the returns from 1802 through 1991 is 7.7 percent instead of 6.8 percent.
OK, back to the argument.
Notice that FactCheck.org’s authority on stock market returns, Jeremy Siegel, specifically noted that the average compound rate of return on stocks stock since 1926 was 10 percent and in contrast the rates for 1802 to 1870 and 1871 to 1925 were 5.8 percent and 7.2 percent respectively.
The chart in Figure 1 shows Jeremy Siegel’s data annotated with a timeline regarding a major structural flaw in the U.S.’ financial system that existed from 1811 through 1935: no central bank. The Jeffersonians of 1811 refused to renew America central bank’s charter when it expired in 1811.
This removed the government’s only effective tool for regulating the money supply, its means for enforcing bank discipline, its means for borrowing money, and its means for preventing major financial institutions from failing in the event of panics. The Jeffersonians, having destroyed the financial regulatory system created by Hamilton, proceeded to replace it with nothing.

Figure 1. A chart of Jeremy Siegel’s data annotated with markers showing the dissolution and reconstitution of the U.S. central bank. The chart shows that the absence of a central back is associated with markedly lower stock market returns.
Thereafter, for the next 124 years, American monetary authorities would simply be unable to intervene decisively so as to abort a market panic before it spiraled out of control. Consequently, as a direct result of Thomas Jefferson’s irrational hatred of banks—which was adopted as his followers as an ideology—economic disaster struck the U.S. roughly every twenty years until our central bank was fully reestablished.
So what difference can a central bank make? Consider the first panic that occurred since 1929: the October 1987 stock market meltdown. This was the worst market crash since 1929. The market had its worse one-day decline—22.8 percent—in history and many thought that that it signaled the start of a new Great Depression.
This time America’s reconstituted central bank, the Federal Reserve, intervened immediately and decisively to stem the panic and to protect the economic institutions from harm. This was first panic since the Federal Reserve was properly reconstituted in 1935 and it averted a financial disaster exactly as Alexander Hamilton intended—for the first time since the market panic of 1792.
The market quickly recovered and fifteen months later it broke new records.
Had there been no central bank to prevent a market panic from causing a catastrophic market crash and the economy required, say, 10 some years to recover, as did following the 1929 crash, then Jeremy Siegel’s data would have shown the post 1925 rate of return as being much less than 10 percent.
Why am I discussing this economic history? Because FactCheck.org used Jeremy Siegel’s average, inflation adjusted stock market returns for the years 1802 through 1991, 6.8 percent, as a baseline market return. This average would be much closer to 10 percent—and probably higher—if we had a central bank between 1811 through 1935.
I say “probably higher” than 10 percent because the Great Depression would have probably been adverted if we had a competent central bank during those years. Preventing the Great Depression would have boosted the 1926-1991 returns above 10 percent.
The chart also shows that the U.S. had reconstituted a rudimentary central bank— the Federal Reserve—in 1913. This is true, but, because of the same psychosis that led us to dispose of our central bank in 1811, our central bank was reborn without the essential powers necessary to be fully functional. The Federal Reserve act finally corrected these deficiencies in 1935, after the Great Depression nearly destroyed our banking system.
Another contributing factor as to why the Federal Reserve failed to avert the crash of 1929: we were still rebuilding our expertise at running central banks. It’s one thing to pass a law establishing a central bank and it is another to build the expertise necessary to run one when a panic hits the fan.
One more point: Jeremy Siegel’s data ends just before 1990’s bull market. This would have boosted the post-1925 returns slightly if they were included.
The changes in the U.S.’ economic structure caused by losing and regaining our central bank is not widely appreciated and I cannot fault the folks at FactCheck.org if they simply didn’t know about these considerations.
That being said, FactCheck.org use of the 1802 –1991 inflation adjusted average causes their analysis to arrive at a low looking, “dovish argument friendly” yields.
I believe that it is reasonable to consider Jeremy Siegel's 10 percent stock market returns for the post 1926 period as a reasonable baseline for forecasting future stock market returns.
In these sorts of political fights both the “hawks” (i.e., the pro-SS reform folks) and “doves” (i.e., the anti-SS reform folks) will seek out data and opinions that favor their argument.
One time-honored tactic is to select the data that makes your argument look the best. I will be using FactCheck.org’s analysis of Bush’s as a concrete example of shopping around for data fits your spin.
First a little about FactCheck.org. They claim to be:
…a nonpartisan, nonprofit, "consumer advocate" for voters that aims to reduce the level of deception and confusion in U.S. politics. We monitor the factual accuracy of what is said by major U.S. political players in the form of TV ads, debates, speeches, interviews, and news releases. Our goal is to apply the best practices of both journalism and scholarship, and to increase public knowledge and understanding.
For my part, I’ve generally considered them to be reasonably fair during the 2004 elections. I have a rather different view of their neutrality regarding Social Security reform, however. I’ve discerned that FactCheck.org—or at least some of the folks who work their—are apparently are opponents of Bush’s Social Security reform.
I have a number of other issues with their analysis of Bush’s proposals but I intend to deconstruct these in a future post.
Social Security “doves” oppose personal accounts. Attacking personal account requires the doves to find data that makes personal accounts appear as unprofitable as possible. Since personal accounts will be at least partially based on stock market returns the doves need defendable data showing the historical stock market returns from the worst available viewpoint. FactCheck.org did this in two ways:
- they presented the average stock market returns from 1802 through 1991, and
- these stock market returns were corrected for inflation
I’ll deal with my second point first. Presenting the stock market returns as corrected for inflation is OK since increases due to inflation are illusionary. Correcting for inflation is presents the investor’s true gains.
It also yields the lowest possible stock market return numbers; which is why I suspect how FactCheck.org selected them.
I normally wouldn’t have thought using inflation corrected stock market returns would have been noteworthy if the rest of FactCheck.org’s analysis was balanced.
OK, now I want to discuss my first point: FactCheck.org presented average stock market returns from 1802 through 1991. On the face of it, it seems prudent to use all of the historical data available, after all, the more data the better right? Well, it isn’t better if you leave out pertinent data.
FactCheck.org used stock market return data provided by Wharton finance professor Jeremy Siegel. Jeremy Siegel determined that average, real (i.e., inflation and depression corrected) stock market returns from 1802 through 1991 was 6.8 percent a year.
So? What’s my problem with this? My issue is that there have been structural changes to our economic system that occurred in 1935 when Federal Reserve act restored to the Federal Reserve all of the powers necessary to make it a fully functional central bank. Furthermore, data provided by FactCheck.org’s own authority on stock market returns, Jeremy Siegel, proves my point.
Jeremy Siegel made the following statement regarding long term prospects for returns on stocks:
The average compound rate of return on stocks from 1802 through 1991 was 7.7 percent per year: 5.8 percent from 1802 to 1870, 7.2 percent from 1871 to 1925, and 10.0 percent from 1926 to 1991.
First, note well that this data is not corrected for inflation. That means, for example, that the returns from 1802 through 1991 is 7.7 percent instead of 6.8 percent.
OK, back to the argument.
Notice that FactCheck.org’s authority on stock market returns, Jeremy Siegel, specifically noted that the average compound rate of return on stocks stock since 1926 was 10 percent and in contrast the rates for 1802 to 1870 and 1871 to 1925 were 5.8 percent and 7.2 percent respectively.
The chart in Figure 1 shows Jeremy Siegel’s data annotated with a timeline regarding a major structural flaw in the U.S.’ financial system that existed from 1811 through 1935: no central bank. The Jeffersonians of 1811 refused to renew America central bank’s charter when it expired in 1811.
This removed the government’s only effective tool for regulating the money supply, its means for enforcing bank discipline, its means for borrowing money, and its means for preventing major financial institutions from failing in the event of panics. The Jeffersonians, having destroyed the financial regulatory system created by Hamilton, proceeded to replace it with nothing.
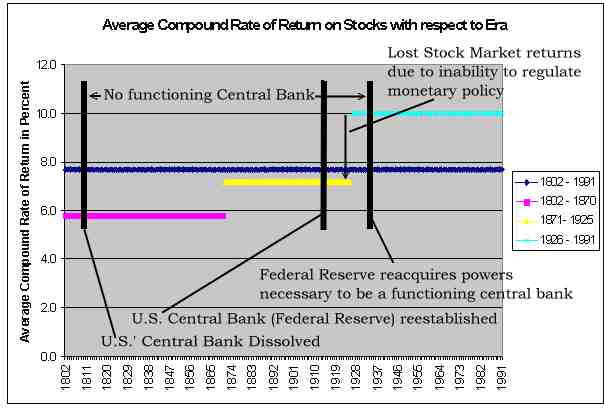
Figure 1. A chart of Jeremy Siegel’s data annotated with markers showing the dissolution and reconstitution of the U.S. central bank. The chart shows that the absence of a central back is associated with markedly lower stock market returns.
Thereafter, for the next 124 years, American monetary authorities would simply be unable to intervene decisively so as to abort a market panic before it spiraled out of control. Consequently, as a direct result of Thomas Jefferson’s irrational hatred of banks—which was adopted as his followers as an ideology—economic disaster struck the U.S. roughly every twenty years until our central bank was fully reestablished.
So what difference can a central bank make? Consider the first panic that occurred since 1929: the October 1987 stock market meltdown. This was the worst market crash since 1929. The market had its worse one-day decline—22.8 percent—in history and many thought that that it signaled the start of a new Great Depression.
This time America’s reconstituted central bank, the Federal Reserve, intervened immediately and decisively to stem the panic and to protect the economic institutions from harm. This was first panic since the Federal Reserve was properly reconstituted in 1935 and it averted a financial disaster exactly as Alexander Hamilton intended—for the first time since the market panic of 1792.
The market quickly recovered and fifteen months later it broke new records.
Had there been no central bank to prevent a market panic from causing a catastrophic market crash and the economy required, say, 10 some years to recover, as did following the 1929 crash, then Jeremy Siegel’s data would have shown the post 1925 rate of return as being much less than 10 percent.
Why am I discussing this economic history? Because FactCheck.org used Jeremy Siegel’s average, inflation adjusted stock market returns for the years 1802 through 1991, 6.8 percent, as a baseline market return. This average would be much closer to 10 percent—and probably higher—if we had a central bank between 1811 through 1935.
I say “probably higher” than 10 percent because the Great Depression would have probably been adverted if we had a competent central bank during those years. Preventing the Great Depression would have boosted the 1926-1991 returns above 10 percent.
The chart also shows that the U.S. had reconstituted a rudimentary central bank— the Federal Reserve—in 1913. This is true, but, because of the same psychosis that led us to dispose of our central bank in 1811, our central bank was reborn without the essential powers necessary to be fully functional. The Federal Reserve act finally corrected these deficiencies in 1935, after the Great Depression nearly destroyed our banking system.
Another contributing factor as to why the Federal Reserve failed to avert the crash of 1929: we were still rebuilding our expertise at running central banks. It’s one thing to pass a law establishing a central bank and it is another to build the expertise necessary to run one when a panic hits the fan.
One more point: Jeremy Siegel’s data ends just before 1990’s bull market. This would have boosted the post-1925 returns slightly if they were included.
Conclusion
The changes in the U.S.’ economic structure caused by losing and regaining our central bank is not widely appreciated and I cannot fault the folks at FactCheck.org if they simply didn’t know about these considerations.
That being said, FactCheck.org use of the 1802 –1991 inflation adjusted average causes their analysis to arrive at a low looking, “dovish argument friendly” yields.
I believe that it is reasonable to consider Jeremy Siegel's 10 percent stock market returns for the post 1926 period as a reasonable baseline for forecasting future stock market returns.
posted by johnh | 2:36 PM
![]()
<< Home