


Steven den Beste notices interesting trends in the polls
Steven den Beste noticed some interesting data within the poll plots derived by Real Clear Politics.
A few words about Steven den Beste: among other things, he designed electronic test equipment during a substantial part of his career. It so happens that I was one of unknowing users of his work when I was a hardware test engineer during the same few years that he was designing equipment.
Anyway, the designers of test equipment are accustomed to not only making measurements but they become accustomed to both identifying the data that results from bad measurements and rejecting this bad data.
Rejecting bad data improves test equipment’s performance.
Now a word about Real Clear Politics: this site—which appears to be unbiased to me—publishes a chart that plots the average derived from a set of national polls (e.g., Zogby, Time, Gallup, CNN, ABC, CBS, et al).
Now back to Steven den Beste’s insight.
While reviewing Real Clear Politics’ poll plots Steven was struck by the what he recognized as indications of bad data. Here’s Steven:
Steven den Beste worked with Real Clear Politics’ data to generate the following plot:
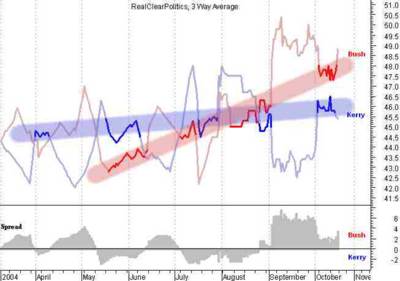
Real Clear Politics’ Poll Plots with den Beste's filtering added. Red is Bush and blue is Kerry.
Removing the data that Steven identifies as either noise or poll sampling error shows Bush slowly overtaking Kerry around July/August and terminating with a 2 point lead around November 2nd.
I recommend that you read den Beste’s post to get all of the details
Hat tip The Belmont Club
Update:
I just read wretchard's commentary on den Beste's post and, as usual, it is excellent.
Update:
Bob White also looked at the Real Clear Politics’ three-way race chart and annotated the poll-spread timeline with certain political significant events. The poll-spread timeline is a histogram that shows the extent that Bush is either leading or trailing Kerry. The histogram’s data is derived by subtracting Kerry’s composite poll numbers from Bush’s composite poll numbers.
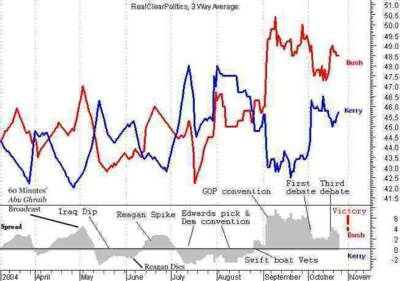
Real Clear Politics’ three-way race chart with annotations identifying time and nature of significant political events. (Click to see full size image.)
Bob identified eight distinct political events; four of which exactly coincided with sharp changes in the poll-spread timeline. I added two more events, the 60 Minutes II broadcast on Abu Ghraib and Reagan’s death, to support my commentary. The events related to sharp changes are:
Two of these events (i.e., the debates) were one-night affairs that coincided with dramatic changes in the polls. The other two events (i.e., the Swiftboat ads and the GOP convention) were not one day events— the Swiftboat ads are still running to this day—and yet the poll spread changed dramatically on the launch of these events.
The other four events took at least a week to run their course and didn’t coincide with any dramatic changes in the poll spread. 60 Minutes II broadcast the Abu Ghraib on April 28th and the MSM clung to this story, reciting it with an iron determination, until Reagan’s death on June 5th forced them to temporarily change the subject for about a week.
The poll-spread timeline shows Bush’s number began to decline just before May 1st (the 60 Minutes II broadcast) and began to recover around the first week in June (Reagan’s death). Bush’s numbers rose and plateaued-off at around +2 percent for three weeks before declining again under the influence of resumed Abu Ghraib and “Iraq is a mess” coverage.
Bush’s numbers returned to negative territory (i.e., Kerry was leading Bush) until late August. During this time Kerry named Edwards as his running mate on July 6th and the Democratic National Convention ran from July 26th to July 29th. Nothing the Democrats did seems to have any affect on the poll number (remember all of the marveling at the Kerry’s “bounce less” convention?)
Except for the respite that occurred when Reagan died, Bush had relentlessly terrible news from May until September and this suppressed his poll numbers. My recollection is that the MSM relentless talked-up the Abu Ghraib scandal ad nauseum and considered it topic ‘A’ until the DNC convention.
The Democrat’s Convention also kept Bush’s numbers down but couldn’t make them any worse. It appears that a Kerry lead of about +2 percent is a floor that Bush couldn’t fall through if he tried.
Regarding Bush’s bounce following Reagan’s death
Bush’s bounce following Reagan’s death wasn’t abrupt. It took awhile for memories to be refreshed and for Reagan and Bush to be mentally compared. The bounce that occurred after Reagan’s death occurred not because sympathy was somehow transferred from Reagan’s family to Bush but because Reagan reminded everyone of how much more effective Republican administrations are at foreign policy and national security.
Of course the news commentators strained themselves to avoid discussing this blindingly obvious contrast with the Democrat’s best efforts and would only discuss Reagan in terms of his exceptional personality, his acting career, his sense of humor, joke telling and jelly beans.
Not discussed was Reagan’s rollback of communist infestations in Granada, Nicaragua, El Salvador—which Kerry opposed.
Not discussed was Reagan’s successful challenge of the USSR’s deployment of SS20 missiles in Eastern Europe by counter deploying Pershing and cruise missiles to NATO—which Kerry opposed.
Not discussed was Reagan’s dismissal of the massive leftist demonstrations in Western Europe demanding the removal of missiles from European soil (our missiles, not Russia’s, of course); which similar to current demonstrations against our war on terrorists.
Not discussed was Reagan’s defense buildup—which contributed to the USSR’s collapse and our victory over Saddam during Gulf War I—which Kerry opposed.
And the MSM commentators were completely silent as to how their current portrayal of Bush is exactly the same way they always portrayed Reagan when he was president; as a clueless dolt that was always on the verge of destroying the world.
I think that Reagan’s death reminded those of us who are old enough to remember Reagan’s era that that Reagan was right and that the MSM was dead wrong. They remember that Kerry opposed Reagan’s effective policies. I believe that these same people had to have noticed that the MSM’s treatment of Reagan and Bush is identical and began to discount the MSM non-stop bad news drivel. They probably realized that anyone so persecuted by the MSM might have been correct all along; just like Reagan.
The bounce that occurred after Reagan’s death lasted for about three weeks before beginning to decline. The MSM’s relentless storyline about Iraq and Abu Ghraib began to reassert itself and Kerry got his lead back.
As an aside, I wonder what went through the MTV slacker’s minds during Reagan’s funereal as they listened to the MSM’s droids drone endless about his jokes and jellybeans? They are too young to remember anything about Reagan and his accomplishments. They had to have been puzzled as to how anybody with so little talent could get so much respect.
Regarding why Bush’s poll numbers are robust and Kerry’s are brittle
Four of the political event’s added to the chart coincided with abrupt changes in the poll spread timeline. Three events, the Swiftboat ads, the GOP convention (August 30th through September 2nd) and the third debate, all seemed to have an immediate and sharp effect. Note that little polling was conducted during conventions so the jump from the GOP convention occurred when polling resumed after the convention.
Except for the first debate, all abrupt movements were in Bush’s favor. Kerry’s gains were gradual; moving slowly as the MSM’s monochromatic backdrop of bad news took its toll on Bush’s poll numbers. Bush’s poll numbers, in contrast, seem to be positively buoyant. Bush’s numbers pop right back up whenever the backdrop of bad news is removed.
I conclude that Bush’s normal numbers are something like +2 percent. The MSM is capable of hauling Kerry into positive numbers but it cannot be sustained without sufficiently bad news to work with; it isn’t sustainable.
Of course some of the data in the same chart contradicts my conclusion. Regarding Bush’s steep drop following the first debate: I don’t have an airtight explanation. I suspect the MSM just talked down Bush’s performance and persuaded the people who were subsequently polled that Bush’s performance was poor. I didn’t think it was poor and neither did the Kerry campaign’s staff—at least when they thought they were having private conversations.
Also the data prior to the 60 Minutes II broadcast shows no abrupt changes; it just undulates. Why? I don’t know. I suspect the imminent election has focused a lot of minds. I know that the Bush campaign was simply silent before the GOP convention and not defending itself from even the most moonbatian allegations. This behavior is useful for gulling the opposition further into indefensible positions but it doesn’t help the poll numbers.
In any case, the Bush campaign passivity in the face of Democratic attack is no longer a problem; they have both feet on the accelerator and firing back with gusto.
My conclusion: It looks to me that Bush has a latent 2-4 percent advantage over Kerry.
I want to thank milkchaser for his work on the annotated chart.
A few words about Steven den Beste: among other things, he designed electronic test equipment during a substantial part of his career. It so happens that I was one of unknowing users of his work when I was a hardware test engineer during the same few years that he was designing equipment.
Anyway, the designers of test equipment are accustomed to not only making measurements but they become accustomed to both identifying the data that results from bad measurements and rejecting this bad data.
Rejecting bad data improves test equipment’s performance.
Now a word about Real Clear Politics: this site—which appears to be unbiased to me—publishes a chart that plots the average derived from a set of national polls (e.g., Zogby, Time, Gallup, CNN, ABC, CBS, et al).
Now back to Steven den Beste’s insight.
While reviewing Real Clear Politics’ poll plots Steven was struck by the what he recognized as indications of bad data. Here’s Steven:
If I saw something like that in scientific or engineering data, I'd be asking a lot of very tough questions. My first suspicion would be that the test equipment was broken, but in the case of opinion polls there is no such thing. My second suspicion would be fraud.
Steven den Beste worked with Real Clear Politics’ data to generate the following plot:

Real Clear Politics’ Poll Plots with den Beste's filtering added. Red is Bush and blue is Kerry.
Removing the data that Steven identifies as either noise or poll sampling error shows Bush slowly overtaking Kerry around July/August and terminating with a 2 point lead around November 2nd.
I recommend that you read den Beste’s post to get all of the details
Hat tip The Belmont Club
Update:
I just read wretchard's commentary on den Beste's post and, as usual, it is excellent.
Update:
Bob White also looked at the Real Clear Politics’ three-way race chart and annotated the poll-spread timeline with certain political significant events. The poll-spread timeline is a histogram that shows the extent that Bush is either leading or trailing Kerry. The histogram’s data is derived by subtracting Kerry’s composite poll numbers from Bush’s composite poll numbers.
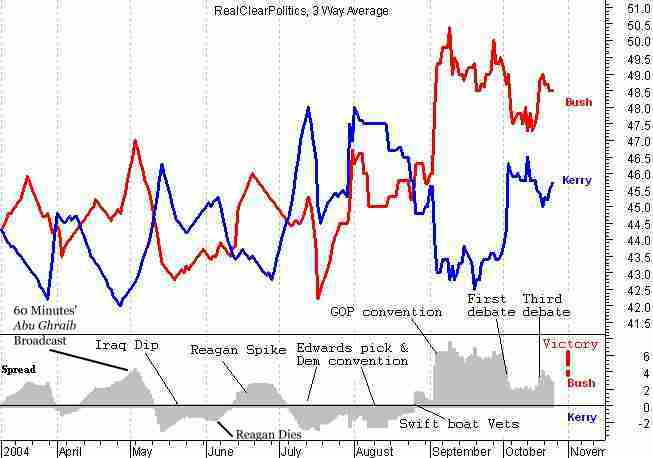
Real Clear Politics’ three-way race chart with annotations identifying time and nature of significant political events. (Click to see full size image.)
Bob identified eight distinct political events; four of which exactly coincided with sharp changes in the poll-spread timeline. I added two more events, the 60 Minutes II broadcast on Abu Ghraib and Reagan’s death, to support my commentary. The events related to sharp changes are:
- The Swiftboat ads
- The GOP convention
- The first debate
- The third debate
Two of these events (i.e., the debates) were one-night affairs that coincided with dramatic changes in the polls. The other two events (i.e., the Swiftboat ads and the GOP convention) were not one day events— the Swiftboat ads are still running to this day—and yet the poll spread changed dramatically on the launch of these events.
The other four events took at least a week to run their course and didn’t coincide with any dramatic changes in the poll spread. 60 Minutes II broadcast the Abu Ghraib on April 28th and the MSM clung to this story, reciting it with an iron determination, until Reagan’s death on June 5th forced them to temporarily change the subject for about a week.
The poll-spread timeline shows Bush’s number began to decline just before May 1st (the 60 Minutes II broadcast) and began to recover around the first week in June (Reagan’s death). Bush’s numbers rose and plateaued-off at around +2 percent for three weeks before declining again under the influence of resumed Abu Ghraib and “Iraq is a mess” coverage.
Bush’s numbers returned to negative territory (i.e., Kerry was leading Bush) until late August. During this time Kerry named Edwards as his running mate on July 6th and the Democratic National Convention ran from July 26th to July 29th. Nothing the Democrats did seems to have any affect on the poll number (remember all of the marveling at the Kerry’s “bounce less” convention?)
Except for the respite that occurred when Reagan died, Bush had relentlessly terrible news from May until September and this suppressed his poll numbers. My recollection is that the MSM relentless talked-up the Abu Ghraib scandal ad nauseum and considered it topic ‘A’ until the DNC convention.
The Democrat’s Convention also kept Bush’s numbers down but couldn’t make them any worse. It appears that a Kerry lead of about +2 percent is a floor that Bush couldn’t fall through if he tried.
Regarding Bush’s bounce following Reagan’s death
Bush’s bounce following Reagan’s death wasn’t abrupt. It took awhile for memories to be refreshed and for Reagan and Bush to be mentally compared. The bounce that occurred after Reagan’s death occurred not because sympathy was somehow transferred from Reagan’s family to Bush but because Reagan reminded everyone of how much more effective Republican administrations are at foreign policy and national security.
Of course the news commentators strained themselves to avoid discussing this blindingly obvious contrast with the Democrat’s best efforts and would only discuss Reagan in terms of his exceptional personality, his acting career, his sense of humor, joke telling and jelly beans.
Not discussed was Reagan’s rollback of communist infestations in Granada, Nicaragua, El Salvador—which Kerry opposed.
Not discussed was Reagan’s successful challenge of the USSR’s deployment of SS20 missiles in Eastern Europe by counter deploying Pershing and cruise missiles to NATO—which Kerry opposed.
Not discussed was Reagan’s dismissal of the massive leftist demonstrations in Western Europe demanding the removal of missiles from European soil (our missiles, not Russia’s, of course); which similar to current demonstrations against our war on terrorists.
Not discussed was Reagan’s defense buildup—which contributed to the USSR’s collapse and our victory over Saddam during Gulf War I—which Kerry opposed.
And the MSM commentators were completely silent as to how their current portrayal of Bush is exactly the same way they always portrayed Reagan when he was president; as a clueless dolt that was always on the verge of destroying the world.
I think that Reagan’s death reminded those of us who are old enough to remember Reagan’s era that that Reagan was right and that the MSM was dead wrong. They remember that Kerry opposed Reagan’s effective policies. I believe that these same people had to have noticed that the MSM’s treatment of Reagan and Bush is identical and began to discount the MSM non-stop bad news drivel. They probably realized that anyone so persecuted by the MSM might have been correct all along; just like Reagan.
The bounce that occurred after Reagan’s death lasted for about three weeks before beginning to decline. The MSM’s relentless storyline about Iraq and Abu Ghraib began to reassert itself and Kerry got his lead back.
As an aside, I wonder what went through the MTV slacker’s minds during Reagan’s funereal as they listened to the MSM’s droids drone endless about his jokes and jellybeans? They are too young to remember anything about Reagan and his accomplishments. They had to have been puzzled as to how anybody with so little talent could get so much respect.
Regarding why Bush’s poll numbers are robust and Kerry’s are brittle
Four of the political event’s added to the chart coincided with abrupt changes in the poll spread timeline. Three events, the Swiftboat ads, the GOP convention (August 30th through September 2nd) and the third debate, all seemed to have an immediate and sharp effect. Note that little polling was conducted during conventions so the jump from the GOP convention occurred when polling resumed after the convention.
Except for the first debate, all abrupt movements were in Bush’s favor. Kerry’s gains were gradual; moving slowly as the MSM’s monochromatic backdrop of bad news took its toll on Bush’s poll numbers. Bush’s poll numbers, in contrast, seem to be positively buoyant. Bush’s numbers pop right back up whenever the backdrop of bad news is removed.
I conclude that Bush’s normal numbers are something like +2 percent. The MSM is capable of hauling Kerry into positive numbers but it cannot be sustained without sufficiently bad news to work with; it isn’t sustainable.
Of course some of the data in the same chart contradicts my conclusion. Regarding Bush’s steep drop following the first debate: I don’t have an airtight explanation. I suspect the MSM just talked down Bush’s performance and persuaded the people who were subsequently polled that Bush’s performance was poor. I didn’t think it was poor and neither did the Kerry campaign’s staff—at least when they thought they were having private conversations.
Also the data prior to the 60 Minutes II broadcast shows no abrupt changes; it just undulates. Why? I don’t know. I suspect the imminent election has focused a lot of minds. I know that the Bush campaign was simply silent before the GOP convention and not defending itself from even the most moonbatian allegations. This behavior is useful for gulling the opposition further into indefensible positions but it doesn’t help the poll numbers.
In any case, the Bush campaign passivity in the face of Democratic attack is no longer a problem; they have both feet on the accelerator and firing back with gusto.
My conclusion: It looks to me that Bush has a latent 2-4 percent advantage over Kerry.
I want to thank milkchaser for his work on the annotated chart.
posted by johnh | 12:20 PM
![]()
<< Home